In this module, we systematically verify the functionality of our designed components through two main cycles of experiments and analyses.
Cycle 1: Functional Verification of Each Tag
Design1
We have found three functional peptides, Tat peptide, Gala3, and pelB, which promote cell permeability, endosomal escape, and exocytosis, and obtained a target peptide that specifically targets the Aquaporin 0 on lens cell through modeling software and AI-assisted design. In this cycle, we need to first fuse each tag with RNF114 through a linker to verify the effectiveness of each tag.
Construction1
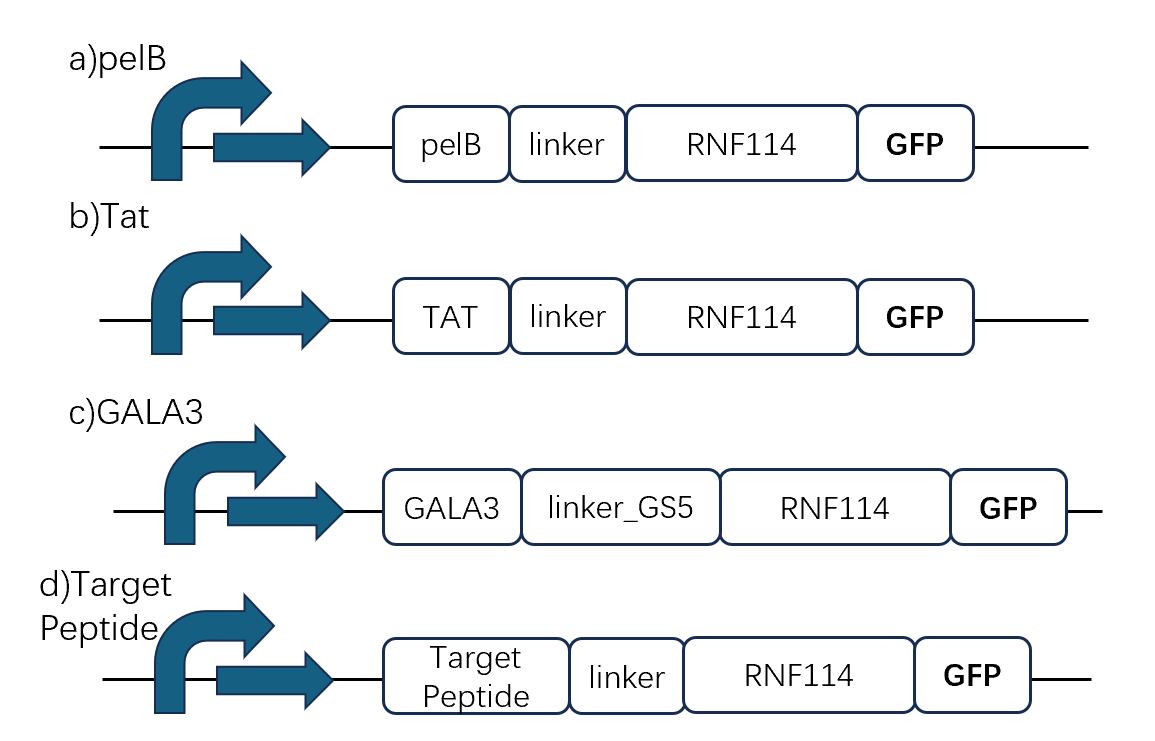
In order to characterize the role of each part, we decided to construct the following gene pathways by chemical synthesis:
Test1
0. Verification the success of plasmid introduction
Sanger sequencing; extraction of plasmid DNA (alkaline SDS separation); determination of DNA size and concentration by gel electrophoresis and Nanodrop.
1. pelB tag[1]
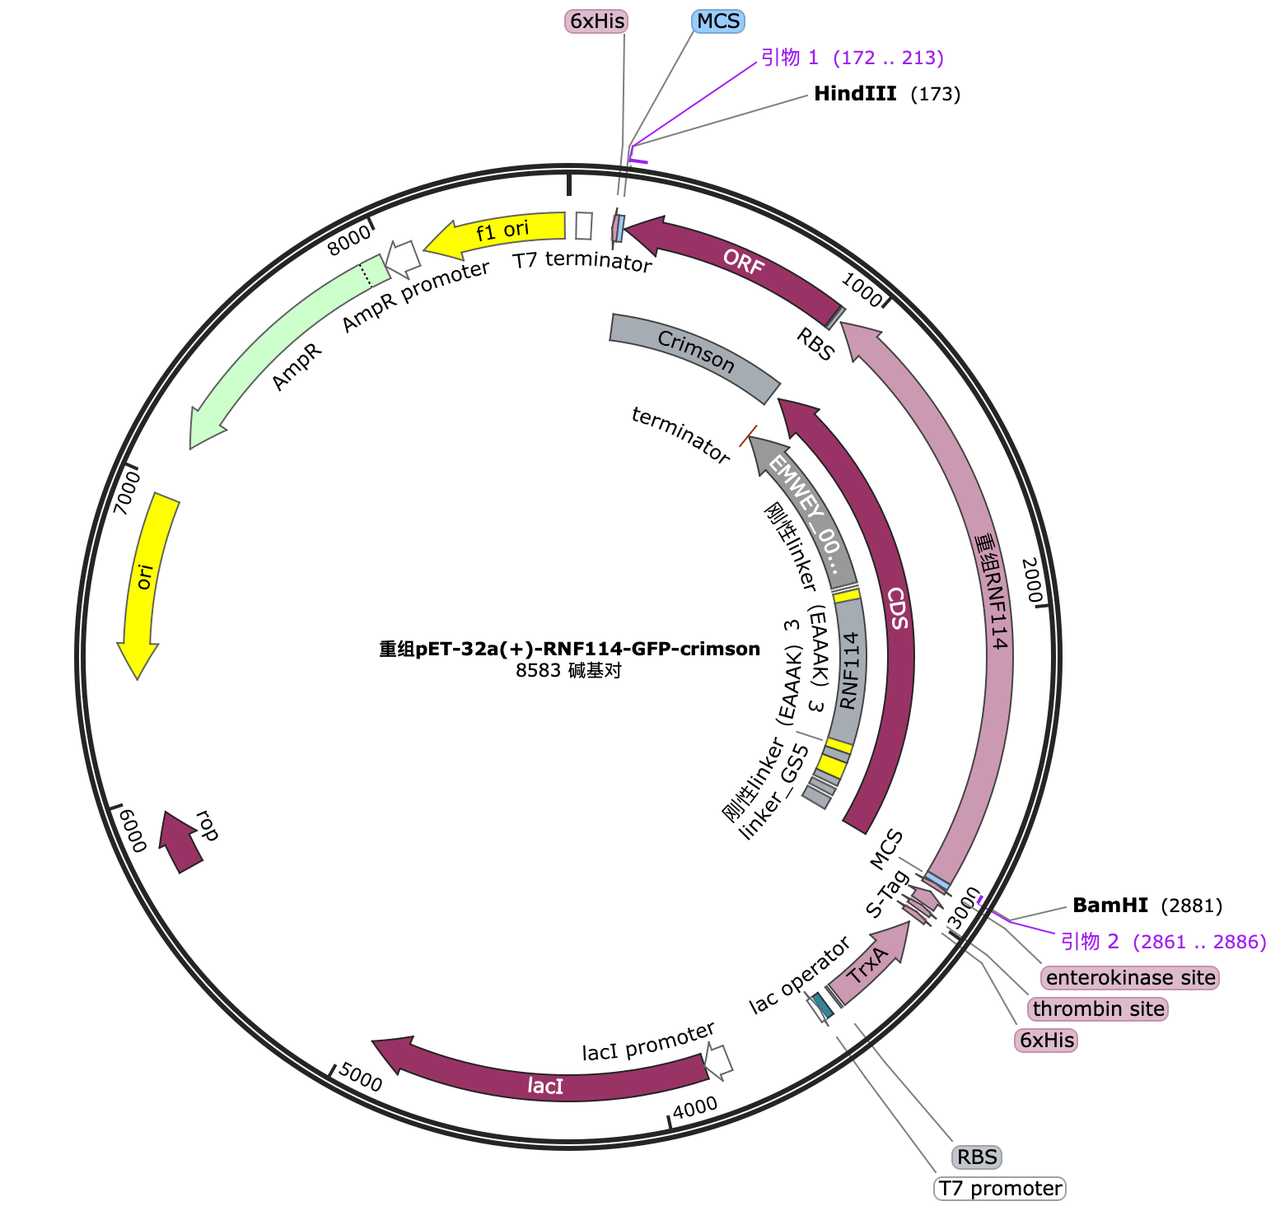
- A. Construction of plasmids, group 1: pelB-linker-RNF114-GPF; group 2: linker-RNF114-GPF; group 3: vector linearization and reconnection to obtain an empty vector, and then transformed into the target strain.
- B. Use a mild induction regimen (0.05 mM IPTG, 30℃, 2hrs)to express and secrete proteins. Centrifuge and take the supernatant.
- C. Determine the relative molecular weight of the protein using 12% SDS-PAGE and perform quantitative analysis using ImageJ.
2. Tat peptide tag[2]
- A. Construction of plasmids, group1: TAT-linker-RNF114-GPF; group2: linker-RNF114-GPF; group3: vector linearization and reconnection to obtain an empty vector, and then transformed into the target strain.
- B. Cultivate strains, extract and purify secretory proteins.
- C. Culture lens epithelial cells and co-incubate with the target protein for 1 h. Centrifuge at 1 000 x g for 10 min, collect cells from each well, wash three times with PBS, collect cells using FASCaliber flow cytometer, and analyze cell penetration using CellQuest software.
3. GALA3 tag[3]
- A. Construction of plasmids, group1: GALA-linker-RNF114-GPF; group2: linker-RNF114-GPF; group3: vector linearization and reconnection to obtain an empty vector, and then transformed into the target strain.
- B. Cultivate strains, extract and purify secretory proteins.
- C. Lens epithelial cells were incubated with different concentrations (0.125, 0.25, and 1 μM) of the protein for 12 h, co-stained with DAPI and observed by fluorescence microscopy, and the fluorescence intensity was quantified by flow cytometry.
4. Target peptide[4]
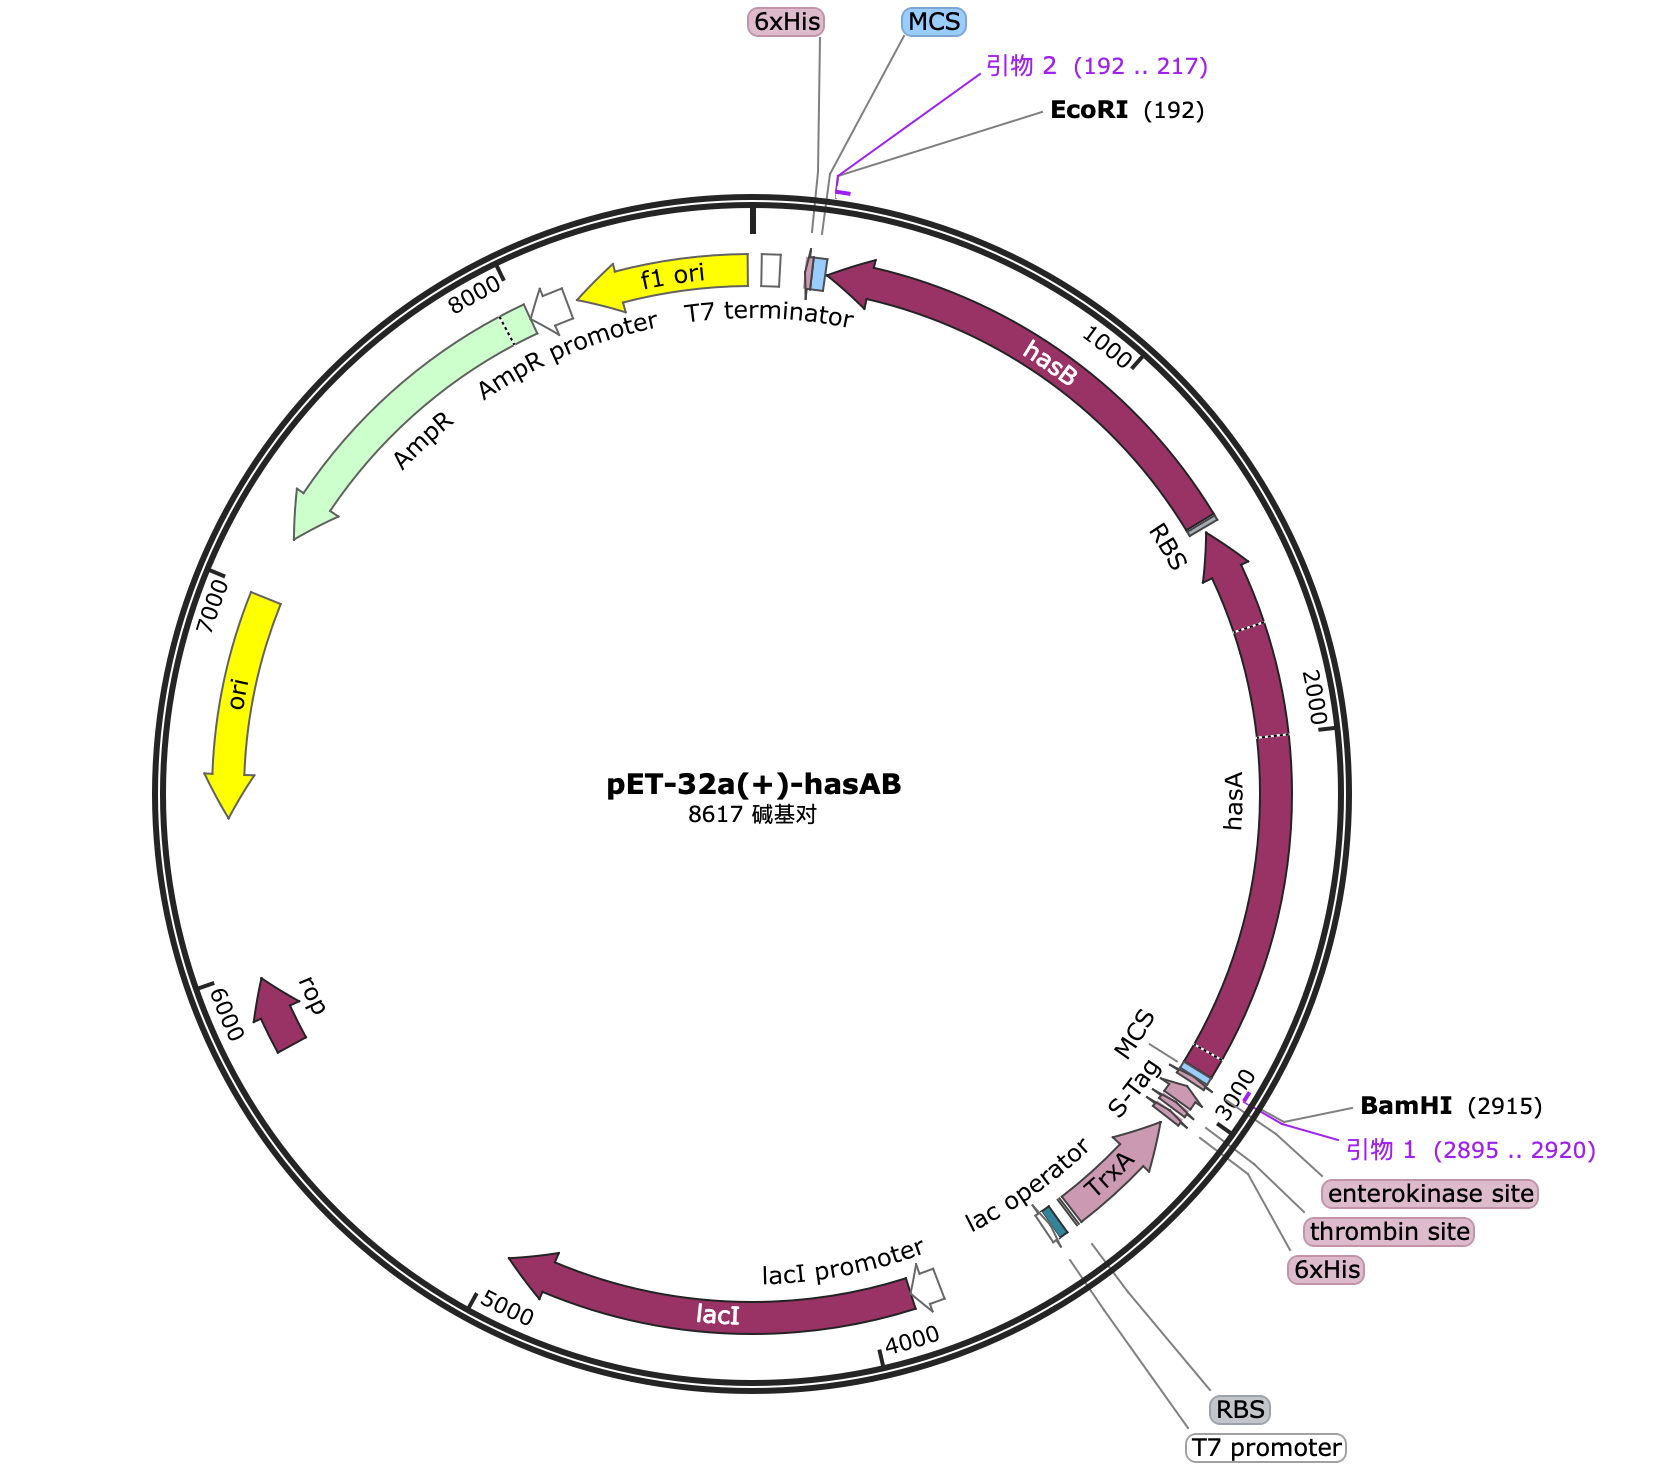
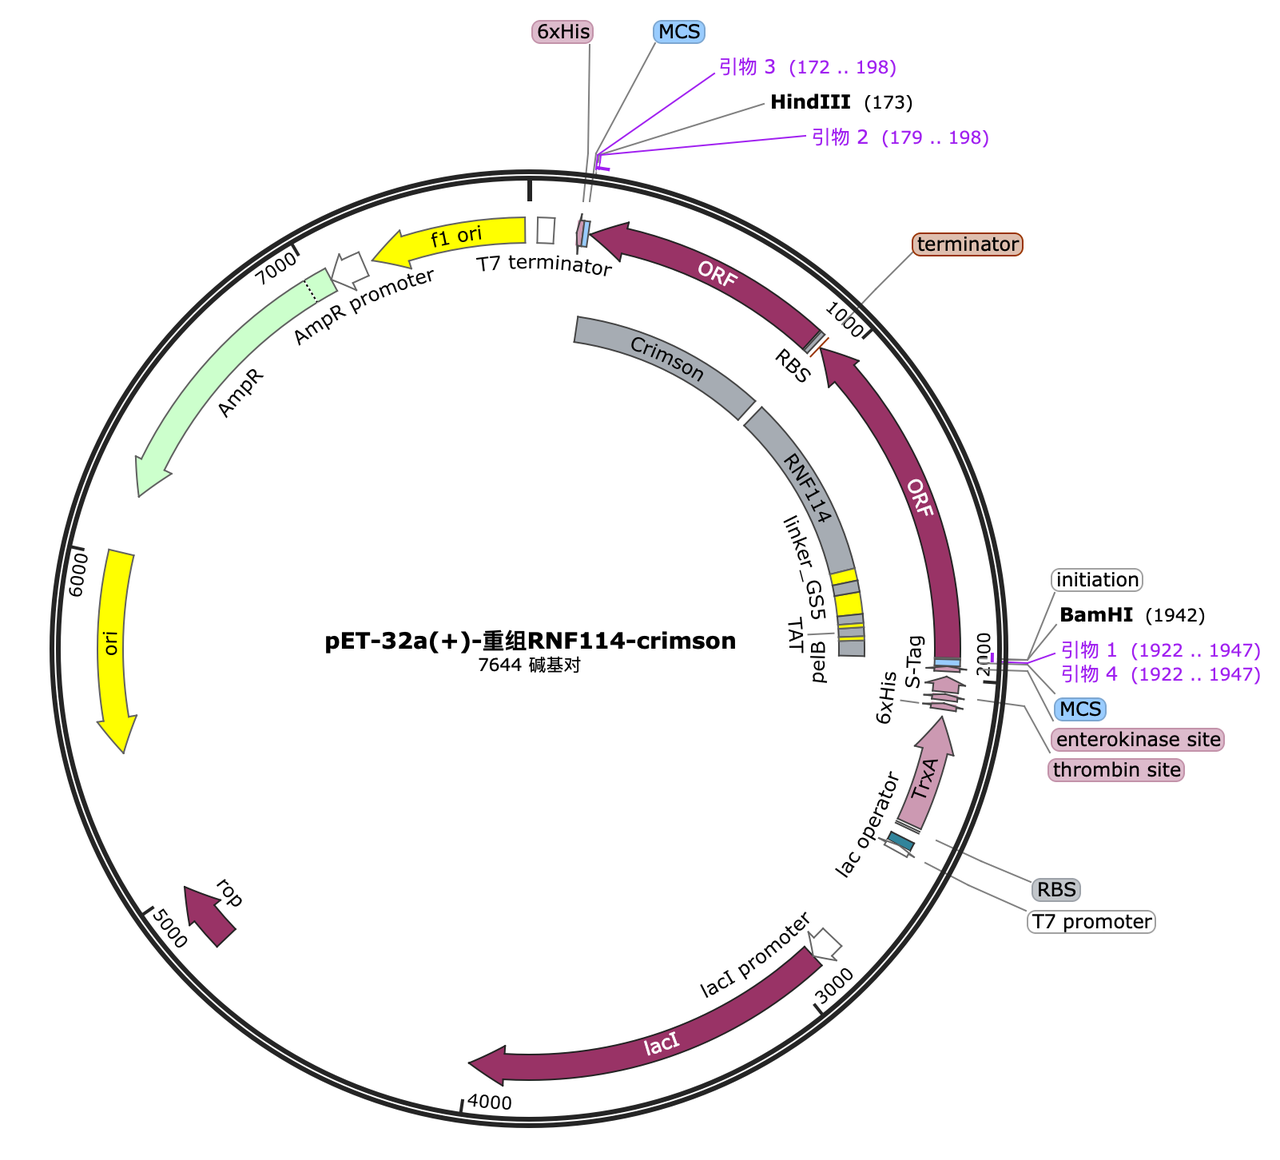
- A. Construction of plasmids, group1: Targetpeptide-linker-RNF114-GPF; group2: Targetpeptide-linker-RNF114; group3: vector linearization and reconnection to obtain an empty vector, and then transformed into the target strain
- B. Cultivate strains, extract and purify secretory proteins
- C. Fluorescence polarization immunoassay to detect affinity: Add a certain amount of GFP-labeled fusion protein and AQP0 to the reaction system. Add different concentrations of unlabeled fusion protein to compete with GFP-labeled fusion protein for binding to AQP0, and fit the competition binding curve.
Learn1
If all tags can play their corresponding functions, it means that the general idea of protein fusion is fine and the next step of overall fusion can be carried out. If the results do not meet expectations, redesign or search for alternative solutions and feedback, optimize the experimental methods before re-verify.
Cycle 2: Functional Verification of the Fusion Protein
Design2
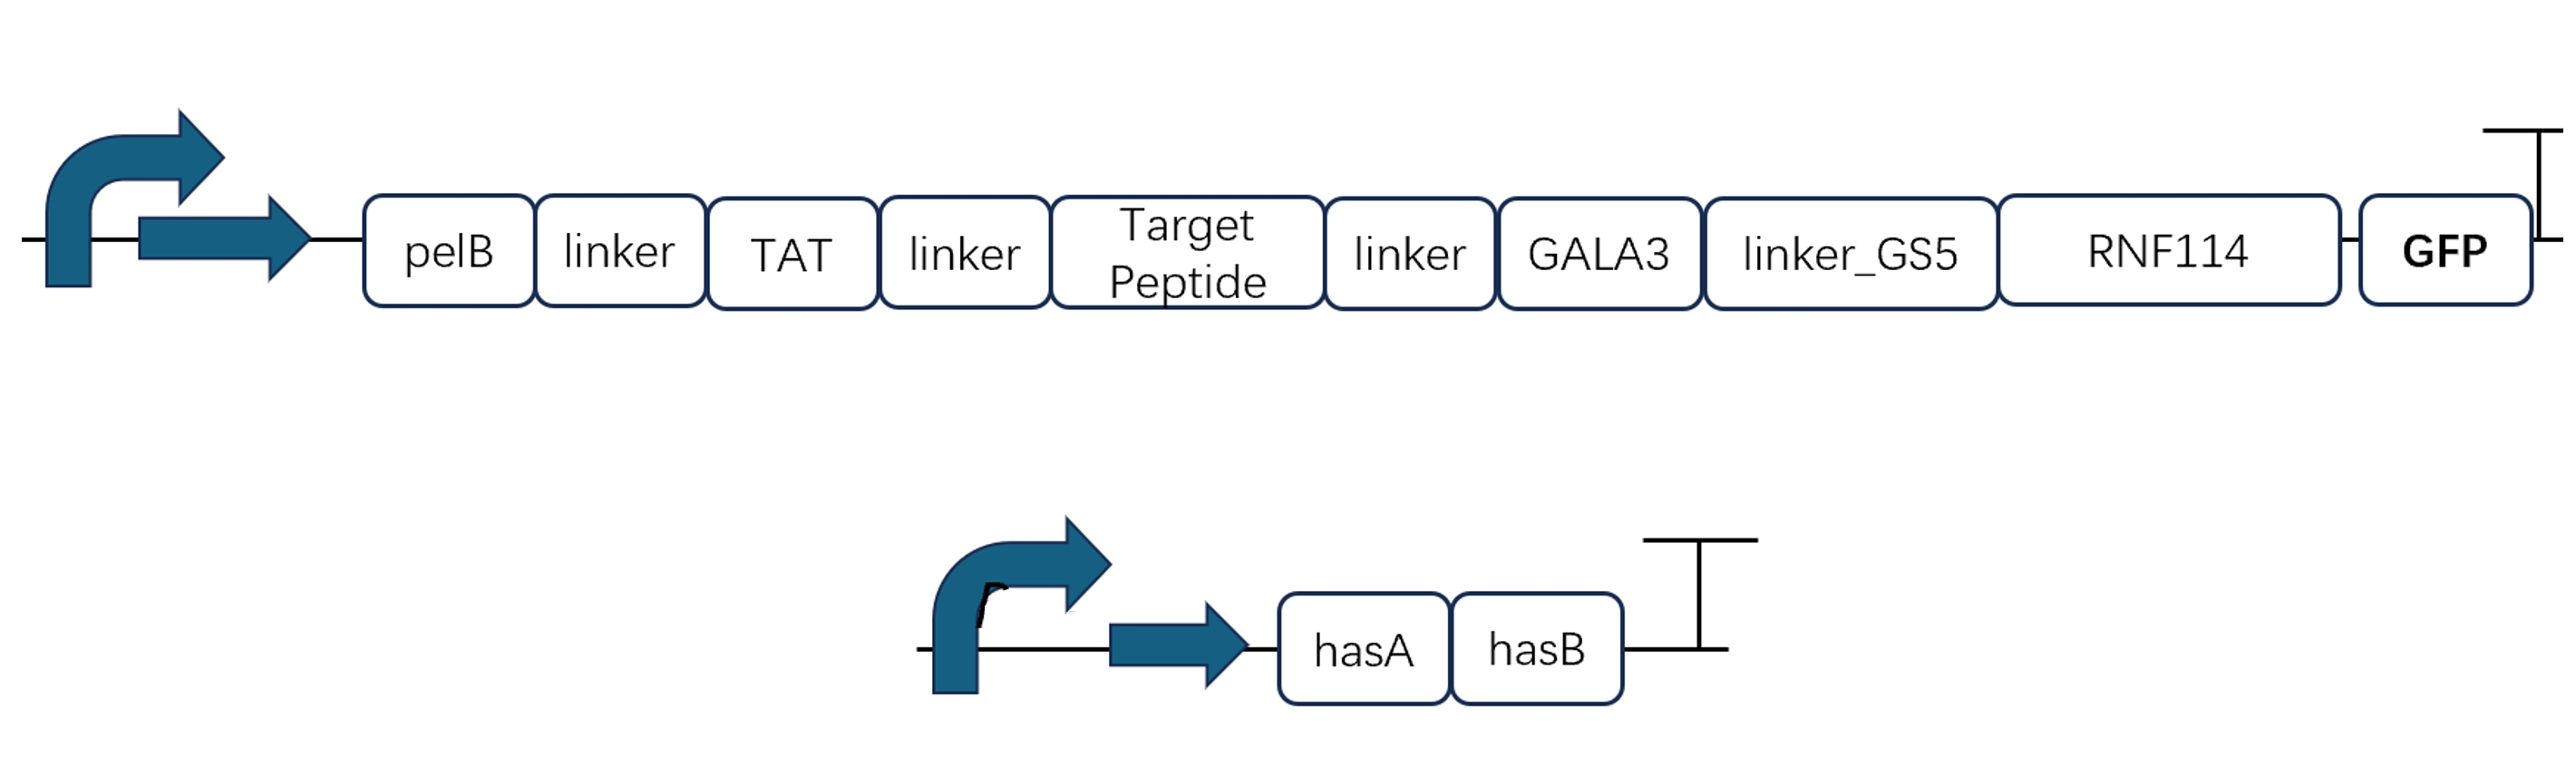
Since our ultimate goal is to obtain a fusion protein with the functions of all the above tags, we decided to construct a gene pathway containing all peptide modifications in the second cycle and verify the functions of each part again. In order to optimize its spatial structure without affecting the domain (Ring-Finger structure) of the original protein, we continuously optimized the modification position and the length of the connecting peptide, and finally obtained the best and most qualified predicted protein structure and corresponding gene pathway.
Construction2
Through the elements that have been successfully constructed and verified in cycle 1, we can construct the gene of the complete fusion protein by PCR. The gene and hyaluronic acid synthesis gene pathway are as follows:
Test2
0. Verification of successful plasmid introduction: DNA sanger sequencing, size and concentration detection
1. Expression of fusion protein
2. Extraction and purification of fusion protein
3. Verify the stability of fusion protein:
Stability improvement plan: [Preferred plan (1), if the effect does not meet expectations, continue to further verify the plan (2)]
- Hyaluronic acid encapsulation
- Rare amino acid replacement
Verification method:
Hyaluronic acid and fusion protein (containing GFP tag) are added to the culture medium containing hydrolase in proportion (the specific concentration needs to be determined in advance), and bleached by a short light pulse. Bleaching causes the labeled protein to be divided into two subgroups - fluorescent protein and non-fluorescent protein. The fluorescence recovery rate after bleaching is related to the degradation rate. The fluorescence intensity is quantified by flow cytometry at intervals.[5]
Type and content of enzyme added:[6][7]
- MMP1, 2, 9, 13
- Cathepsin A (in aqueous humor); Cathepsin V, K, B, S. Compared with Cathepsin S, Cathepsin V has the highest expression (about 200 times), followed by Cathepsin L and Cathepsin B (about 10 times and 5 times, respectively)
4. Verify the therapeutic function of the fusion protein[8]
- A. Rat lens epithelial cells were placed in culture medium and incubated at 4°C for 24 hours to induce cataracts. 100 μM fusion protein was added to the culture medium in the last 30 minutes of low temperature treatment in the experimental group, but not in the control group. The lenses were transferred to a 37°C environment for 30 minutes.
- B. After rewarming, the rat lens of the control group was placed in a dish containing extracellular solution and placed above the bottom light source of a Nikon SMZ18 microscope, and image A was taken. Subsequently, the light source was turned off and image B was taken to correct for ambient light interference. Then, the rat lens of the experimental group was placed above the bottom light source and image C was taken.
- C. Analyze the grayscale value of the lens area by ImageJ (NIH) and calculate the transmittance according to the following formula:
Learn2
If the fusion protein is stable and its therapeutic function can be performed normally, it can be combined with hydrogel and hardware structure for the next cycle.